Effects of Artificial Light Recipes in Plant Factory on Yield, Quality, and Leaf Microstructure of Purple Leaf Lettuce
——Based on a Comparative Trial of Four Light Source Schemes
Keywords: Plant factory; purple leaf lettuce;plant lamp;plant supplemental light;plant grow light; artificial light; spectral ratio; anthocyanin; palisade tissue
Abstract
To optimize the artificial light recipe for purple leaf lettuce in a plant factory, four light source schemes were set up in a 2.5m×0.6m hydroponic area: Scheme 1 used conventional lamp tubes with a spectral composition of blue light + white light + chip red light (approximately 1:3:1); Scheme 2 used conventional lamp tubes with a spectral composition of white/warm white + chip red light (approximately 4:1); Scheme 3 usedwoven light lamp tubeswith the same spectral composition as Scheme 2; Scheme 4 usedwoven light lamp tubeswith a spectral composition of chip blue light + chip red light (approximately 2:3). All four groups used the same nutrient solution system, with simultaneous planting, management, and harvesting.
The trial results showed that Scheme 4 achieved the highest average fresh weight per plant of 109.0g with the lowest total power of 160W among the four groups, an increase of 12.4% over Scheme 1 and 29.1% over Scheme 2. Scheme 3 had an average fresh weight per plant of 104.0g, an increase of 23.2% over Scheme 2, indicating that the “woven light” model has a significant yield advantage under the same spectrum; however, its coloring performance was similar to Scheme 2, and neither formed a stable purple margin.
In terms of quality performance, Scheme 4 showed widespread and stable purple margin coloring, the mildest bitterness, and good leaf firmness; typical elongated columnar palisade cells with dense arrangement were observed in leaf cross-sections. Schemes 1, 2, and 3 showed no obvious purple margin, and no clear columnar palisade cells were observed under the same sectioning conditions. The preliminary conclusion is that applying the spectral combination of chip blue light + chip red light (approximately 2:3) on our company's “woven light” model is the optimal artificial light scheme with the best overall performance in this trial.
I. Introduction
In artificial light plant factories, the spectral composition, light intensity, and light distribution of the light source jointly determine crop yield and quality. Purple leaf lettuce, as a representative leafy vegetable variety, is highly sensitive to blue light, and its anthocyanin accumulation, leaf morphology, and taste are all affected by the light environment. To clarify the actual effects of different light source schemes, this study conducted a comparative trial of four light source configurations under identical hydroponic conditions, focusing on fresh weight per plant, purple margin coloring, sensory quality, and leaf microstructure, to provide a basis for optimizing the light recipe of the company's plant factory.
II. Materials and Methods
2.1 Trial Materials and Site
The tested variety was purple leaf lettuce. Four independent hydroponic areas were set up, each with an area of 2.5m×0.6m, totaling approximately 1.5㎡. The four areas were located in the same plant factory environment, using the same nutrient solution formula, with consistent planting density, harvesting standards, and management practices.
2.2 Light Source Scheme Design
Scheme | Light Source Type | Spectral Composition | Number of Light Sources | Total Power | Remarks |
Scheme 1 | Xuan Niaolamp tube | Blue light + white light + chip red light, approximately 1:3:1 | 4 rows, connected in series front and back, 8 tubes total, 25W per tube | 200W |
|
Scheme 2 | Xuan Niaolamp tube | White/warm white + chip red light, approximately 4:1 | 4 rows, connected in series front and back, 8 tubes total, 25W per tube | 200W |
|
Scheme 3 | woven light lamp tubes | White/warm white + chip red light, approximately 4:1 | 2 rows, connected in series front and back, 4 tubes total, 50W per tube | 200W |
|
Scheme 4 | woven light lamp tubes | Chip blue light + chip red light, approximately 2:3 | 2 rows, connected in series front and back, 4 tubes total, 40W per tube | 160W |
|
The light source types, spectral compositions, and arrangements of the four schemes are as follows:
This trial focused on comparing two types of variables: first, the difference between conventional lamp tubes and the “woven light” model under the same spectrum; second, the difference between schemes with and without blue light on the same “woven light” platform.
2.3 Measurement Indicators and Methods
Fresh weight per plant: Random sampling was conducted in each area; roots were removed, aboveground fresh weight was weighed, and the average was calculated.
Appearance observation: The area and stability of purple-red coloring on leaf margins and leaf blades were recorded.
Sensory evaluation: After harvest, samples were preliminarily evaluated, focusing on bitterness, leaf firmness, and crispness.
Microstructure observation: Mature functional leaves were taken, hand-sectioned with a double-blade, mounted in water, and observed under an ordinary optical microscope for leaf cross-sectional structure.
III. Results and Analysis
3.1 Fresh Weight per Plant
The average fresh weight per plant for each scheme is as follows:
Scheme | Light Source Type | Spectral Composition | Total Power | Average Fresh Weight per Plant |
Scheme 1 | Conventional lamp tube | Blue light + white light + chip red light 1:3:1 | 200W | 97.0g |
Scheme 2 | Conventional lamp tube | White/warm white + chip red light 4:1 | 200W | 84.4g |
Scheme 3 | Woven light model | White/warm white + chip red light 4:1 | 200W | 104.0g |
Scheme 4 | Woven light model | Chip blue light + chip red light 2:3 | 160W | 109.0g |
From the yield results, it can be seen that:
Scheme 4 had the lowest total power but the highest average weight per plant;
Scheme 4 was approximately 4.8% higher than Scheme 3, 12.4% higher than Scheme 1, and 29.1% higher than Scheme 2;
Scheme 3 and Scheme 2 had the same spectrum, but with the “woven light” model, the yield was significantly higher than Scheme 2, indicating that the light intensity improvement brought by the light source structure has fundamental yield-increasing value;
Both Scheme 4 and Scheme 1 contained blue light spectra, but Scheme 4 was a direct combination of pure chip blue light and chip red light, with more concentrated blue light dosage and more prominent yield enhancement.
3.2 Purple Margin Coloring Performance
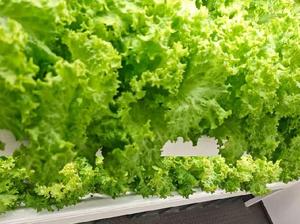
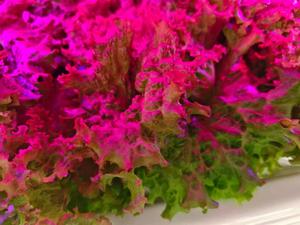
Scheme 4: Purple margin coloring was widespread and stable; obvious purple-red pigment accumulation was visible at leaf margins and parts of leaf vein areas;
Scheme 1: No obvious purple margin was observed, with only extremely slight coloring signs;
Scheme 2: Basically no purple margin; leaves were mainly green;
Scheme 3: No stable purple margin was observed; coloring performance was similar to Scheme 2.
Purple margin formation mainly depends on the induction of the anthocyanin synthesis pathway by blue light. In Scheme 4, blue light was directly output in the form of chip light, with the highest absolute blue light dosage reaching the leaf surface; although Scheme 1 also contained blue light, the blue light ratio was diluted after mixing with white light, failing to reach the threshold for fully inducing purple margin coloring.
3.3 Preliminary Sensory Quality Evaluation
Preliminary sensory evaluation showed:
Scheme 4 had the mildest bitterness, with obvious firmness and crispness in the leaves;
Schemes 1, 2, and 3 all had varying degrees of bitterness, with leaves feeling relatively softer;
The bitterness ranking was: Scheme 2 the most bitter, Scheme 3 next, Scheme 1 next, and Scheme 4 the mildest.
Bitter-tasting substances are secondary metabolites produced by plants under environmental stress or poor light quality. In this trial, the red-blue light combination of Scheme 4 had high photosynthetic efficiency, with plants growing “smoothly” and weaker defensive metabolism, resulting in less bitter substance accumulation; the other schemes had problems such as a high proportion of inefficient light or blue light stress, which may have induced more bitterness-related metabolism.
3.4 Leaf Cross-Sectional Microstructure
Under the same sectioning method and observation conditions:
Scheme 4: Obvious elongated columnar palisade cells were observed, densely arranged with clear layers; even in areas near leaf veins without anthocyanin, the outlines of palisade cells were still visible;
Schemes 1, 2, and 3: Cells in the leaf cross-sections were mostly near-circular or elliptical in shape, appearing plump and rounded, with no clear elongated columnar palisade cell layer observed.
This difference indicates that the leaf tissue density of Scheme 4 was higher, and palisade tissue development was more sufficient. Elongated, densely arranged palisade cells mean more photosynthetic cells per unit leaf area, thicker and firmer leaves, and are also directly related to higher fresh weight per plant.
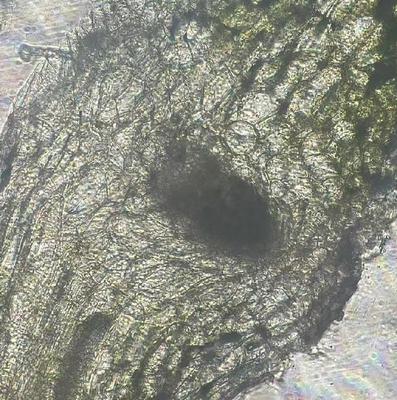
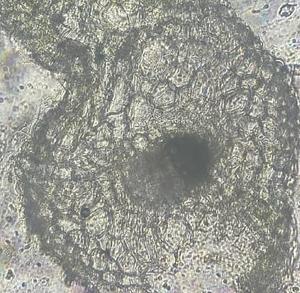
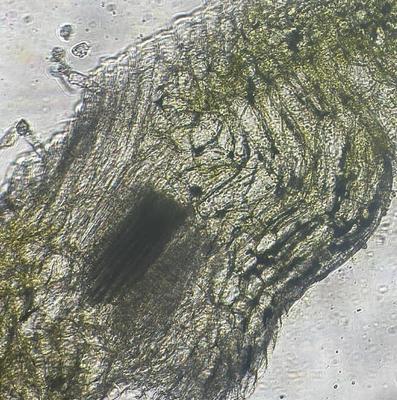
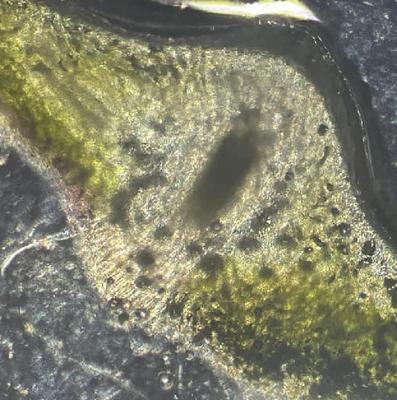
Comparison of leaf cross-sectional microstructure of the four groups
(The order from left to right and top to bottom is 1, 2, 3, 4)
IV. Discussion
4.1 Blue Light Ratio Determines Coloring and Morphological Development
Anthocyanin accumulation in purple leaf lettuce requires blue light stimulation. This study showed that merely “containing blue light in the spectrum” is not sufficient; the key is whether the absolute blue light dosage reaching the leaf surface reaches the threshold.
Scheme 4 had a blue light proportion of approximately 40%, output directly as chip light without white light dilution, thus having the highest blue light dosage among the four groups and the most stable purple margin performance. Although Scheme 1 contained blue light, after white light mixing and light distribution dilution, the absolute blue light dosage was still insufficient to trigger significant coloring.
Blue light also regulates the elongation of palisade cells. The formation of elongated columnar palisade cells in Scheme 4 is consistent with the promoting effect of high-intensity blue light on cell elongation; whereas in Schemes 1, 2, and 3, blue light was insufficient or the dosage was inadequate, leaving palisade cells in a near-circular state with reduced tissue density.
4.2 Light Intensity Gain from Light Source Structure Upgrade
Scheme 3 and Scheme 2 had the same spectrum, but with the “woven light” model, the yield of Scheme 3 was 104.0g, an increase of 23.2% over Scheme 2. This indicates that under the same spectrum, the light intensity improvement brought by the light source structure can significantly increase yield.
However, the coloring performance of Scheme 3 was similar to Scheme 2, with neither forming a stable purple margin, and the taste improvement was limited. This shows that after light intensity increases to a certain level, the constraint of spectral composition on quality becomes prominent. Without sufficient blue light, even with higher light intensity, the desired coloring and leaf morphology of purple leaf lettuce cannot be achieved.
4.3 Total Power and Effective Photon Density
Scheme 4 had a total power of only 160W, comprehensively lower than the other three groups, yet achieved the highest yield. This indicates that the focus of light recipe optimization in plant factories should not be simply increasing power, but improving the utilization efficiency of effective red and blue photons.
The chip blue light + chip red light approximately 2:3 combination of Scheme 4 placed almost all photons within the efficient absorption range of photosynthesis, without the waste of inefficient spectral components in white light. Meanwhile, the “woven light” structure distributed light more effectively to the canopy, further compensating for the potential light intensity disadvantage caused by the lower total power.
4.4 Correspondence between Microstructure and Hand Feel and Weight
The firm leaves, high weight per plant, and obvious purple margin of Scheme 4 all correspond at the micro level to thicker palisade tissue and denser cell arrangement. This structure on the one hand reduces ineffective water filling inside the leaf, and on the other hand increases dry matter content per unit volume, reflecting the dual optimization of yield and taste.
V. Conclusions and Outlook
Under the conditions of this trial:
Scheme 4, namely the combination of our company's “woven light” model + chip blue light + chip red light at approximately 2:3, achieved the highest average weight per plant of 109.0g at a total power of 160W, with stable purple margin coloring, the mildest bitterness, the best leaf firmness, and the most typical palisade cell development, showing the best overall performance.
Scheme 3 had an average fresh weight per plant of 104.0g, higher than Schemes 1 and 2, indicating that the “woven light” model has clear yield-increasing value under the same spectrum; however, limited by the lack of blue light in the spectrum, its coloring and taste performance were still significantly weaker than Scheme 4.
Conventional lamp tubes were limited by spectral dilution and light distribution efficiency at the same power, with overall performance weaker than the “woven light” model; whether the spectrum contains sufficient chip blue light is the key variable determining the coloring and tissue structure formation of purple leaf lettuce.
Subsequently, multiple batches of repeated trials will be conducted based on Scheme 4, and further tests will be carried out on fine-tuning the blue-red ratio and yield performance under different planting densities; meanwhile, quantitative detection of dry matter rate, anthocyanin content, soluble sugars, and bitter substances will be introduced to establish a complete correspondence model from spectral parameters to final commercial quality.
Author: Shandong Xusheng OptoelectronicsTechnology Center
Date: October 2026
Review Status: Internal trial summary, to be updated after expanded validation

